Wall Street’s Last Line of Defense

Updated: Sep 29

Are the Nasdaq and S&P 500 firing the last shots of their advance?
Ali Mirzaei | Weekly chart analysis | September 29, 2026
A market does not always look frightening before a major decline. Prices may still be making highs, candles may be green, and bullish opportunities may appear on shorter timeframes. Precisely then, we need to step back and ask: where does this movement sit within the larger market structure?
My reading of the weekly Nasdaq and S&P 500 charts warns that the advance may be approaching a vulnerable stage. Subsequent price action may confirm or reject that interpretation. I am not announcing an entry point or claiming to know the future. I want to show how classical tools, read together, can flag risk before the outcome is known.
The coach needs a view from the stands
A football coach at the touchline sees individual runs and close challenges. From higher in the stadium, the gaps between lines, the space behind the defence and the formation of the whole team become clearer.
That is how I think about four-hour and weekly analysis. A four-hour rally can be genuine and tradable while also forming the final extension of a larger movement. Strength on the smaller scale does not, by itself, establish the health of the weekly structure.
In my own analysis, I have been waiting for those shorter-term bullish formations. All the photographs in this article show weekly charts; four-hour patterns must be assessed separately on their own timeframe. This is not a dismissal of scalping or newer methods. The point is to avoid separating a small breakout, a consolidation or a few candles from its place in the overall market.

S&P 500 — weekly chart photographed and annotated by Ali Mirzaei. Trendlines are the author’s interpretation; broker quotes may differ from the underlying index.
Dow, peaks and troughs: the framework
In classical trend analysis, the sequence of highs and lows matters. Higher highs and higher lows support the continuation of an uptrend. Yet the same advance can gradually develop a more vulnerable shape.
Two statements can therefore be true together: the trend remains upward, and its structure is warning of possible weakness. A warning that a trend may end is not the same as an actual trend reversal. Nor does observing this situation in the Nasdaq and S&P 500 amount to complete confirmation under Dow Theory; here I am applying the logic of trend structure.
The rising wedge: when shape and implication differ
In my weekly chart photographs, two rising boundaries converge. The lower boundary rises more steeply, while the range between the lines gradually narrows. That geometry provides the basis for examining a rising wedge.
In chapter six of Technical Analysis of the Financial Markets, John Murphy describes the bearish implication of a rising wedge and its possible appearance near the end of an uptrend. This defines a pattern; applying it to today's market is today's analyst's responsibility. [1]
Two corrective lows can be identified for the lower line. The upper boundary aligns with several high areas, although some contacts are not exact or uniform. That limitation belongs in the analysis.
Being near the upper boundary is also different from reaching the exact intersection of the two lines. “Last line of defense” expresses my interpretation of the market's possible position; it is not a precise measurement of the final turning point.

Nasdaq / US100 — weekly chart photographed and annotated by Ali Mirzaei. Trendlines are the author’s interpretation; broker quotes may differ from the underlying index.
What Fidelity's guide adds
Identifying Chart Patterns with Technical Analysis is an educational presentation from Fidelity. Page 27 discusses wedges, while page 6 stresses that a pattern becomes actionable through a breakout. [2]
This links a warning to confirmation. A wedge can attract our attention, but before a break, its bearish outcome cannot be treated as something that has already happened. Citing a respected reference does not mean that it predicted a present-day Nasdaq or S&P 500 crash. The reference explains a method; the current application is my own.
Elliott: the position of the move, not just its shape
In my proposed count, the three advancing legs become progressively shorter: wave one is longest, wave three is not the shortest, and wave five appears smaller. This raises the question of exhaustion, but confirmation requires clearly identified endpoints and internal subdivisions.
An Elliott ending diagonal usually occupies wave five or wave C. Its internal structure and the usual overlap of wave four into wave one's territory also matter. Shortening waves and a wedge-shaped outline alone do not establish a confirmed ending diagonal. [3]
If wave four in the selected count does not overlap wave one, that needs examination. The absence of overlap cannot simply be presented as confirmation. The classical wedge may remain relevant even when the precise Elliott label is unsettled.
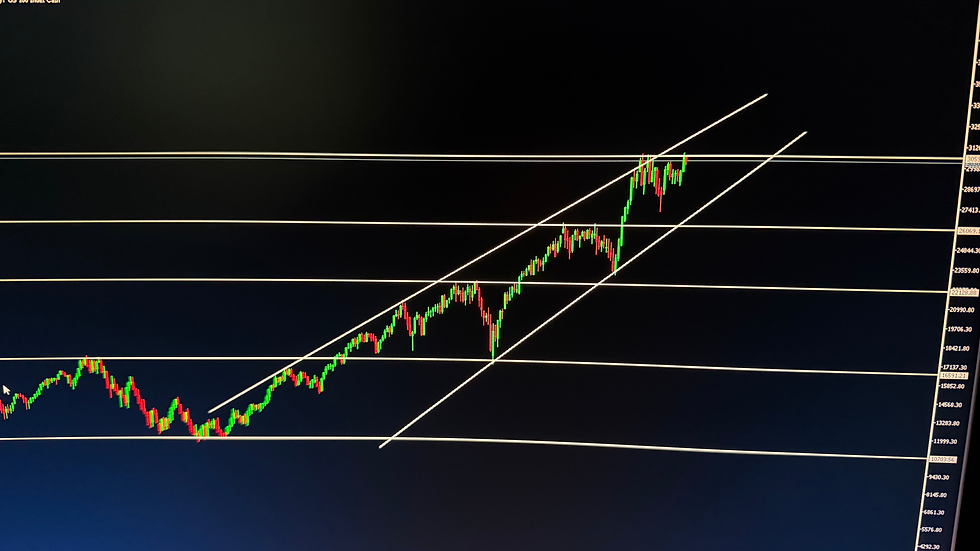
Nasdaq / US100 — weekly chart photographed and annotated by Ali Mirzaei. Alternative angle of the same chart. Trendlines are the author’s interpretation; broker quotes may differ from the underlying index.
Six Signal: reading the connections
My point is not to collect impressive names. Peaks and troughs reveal structure; trendlines define boundaries; patterns describe the movement's shape; wave analysis examines its possible position; and comparison across timeframes adds context. This is the connected reading I pursue through Six Signal.
These tools largely draw on the same price data. Their agreement should not be counted as several completely independent pieces of evidence or a guarantee of success. Their value lies in a coherent interpretation that can be tested and disproved.
Fundamentals: pressure behind the chart
On September 16, 2026, the Federal Reserve raised its target range by 0.25 percentage point to 3.75–4%. The same statement described both elevated inflation and solid economic growth. [4]
August annual consumer inflation was 3.4%, while core inflation was 2.4%. [5] The ten-year Treasury yield rose from 4.79% on September 1 to 5.24% on September 28. [6]
Higher yields can increase financing costs and pressure equity valuations. But rising yields are not synonymous with a collapse in the bond market, and they do not independently identify the date an equity decline will begin. Institutions also differ in their conclusions. BlackRock acknowledges higher government-bond yields while retaining a constructive but selective approach to risk. Fundamental concerns should not be turned into an invented consensus that a crash is inevitable. [7]
Analyst and trader, revisited in a live market
Recognising fundamental risk and reading a weekly structure are analytical tasks. Turning that assessment into a trade raises different questions: what confirms the idea, what invalidates it, and how will potential loss be controlled? One person can perform both roles, but neither role guarantees advance knowledge of the exact turning point.
In my scenario, a weekly close below the wedge's lower boundary, together with the loss of a meaningful corrective low, would strengthen the case for a deeper correction. A failed retest of broken support could add evidence. Conversely, a sustained move above the upper boundary while higher highs and higher lows remain intact would weaken this interpretation.

S&P 500 — weekly chart photographed and annotated by Ali Mirzaei. Alternative angle of the same chart. Trendlines are the author’s interpretation; broker quotes may differ from the underlying index.
Let tomorrow's outcome test today's warning
My personal stance is caution toward fresh, emotionally driven buying near these highs. Insufficient confirmation to sell is not, by itself, sufficient reason to buy. That is not a universal instruction for traders with different horizons and circumstances.
We have not drawn this structure after a historic collapse, already knowing the result. The view is being recorded now; the market will judge it later. For me, the value of classical technical analysis is seeing the whole picture, defining risk and remaining willing to change my mind. The last line of defense may break—or the market may move beyond it and continue higher. Professional analysis needs criteria for both outcomes.
This article presents the author's analytical opinion and is not personalised investment advice. This English edition conveys the same analysis as the Persian original.
Sources and further reading
Related reading: explore our forex and US stock market research. For the distinction between analysis and trade execution, read Analyst or Trader: Architect or Builder?.


Comments